Wednesday, November 7, 2012


Tuesday, November 6, 2012
Day's Anatomy- 5th November 2012

So I'm officially scared. Not of losing money, but of the uncertainty of my decisions (one of the cons of a discretionary approach).
Seriously thinking about returning to SIM with a higher "Pass Rate" necessary to graduate to live trading than I previously imposed on myself.
Sunday, November 4, 2012
Expectations About Expectancy.
Anybody who is serious about becoming a profitable trader will probably know what Expectancy is, if they've been around long enough. But, just in case, here's a quick overview.
Expectancy can be calculated using the following formula:
Expectancy= (Average Win * Win Rate)-(Average Loss * Loss Rate)
This needs to be calculated using a "statistically significant data set"- for a swing trader that might mean testing over years or even decades of data. Intra-day traders will probably need a month or two of data. The time over which your data is collected matters because you are inevitably going to test over various market conditions but the number (N) of trades is crucial. The larger the number, the more reliable the expectancy.
So, let's say you forward/back test a trade idea, taking 100 trades. Your WR is 40% (0.4) and your Avg Win is twice your Avg Loss then...
E= (2 * 0.4)-(1*0.6)=0.2... This means, on average, you make 20% (0.2) of whatever your risk (R) is per trade for every trade you make. Positive Expectancy! Yay!
But that's only half the story.


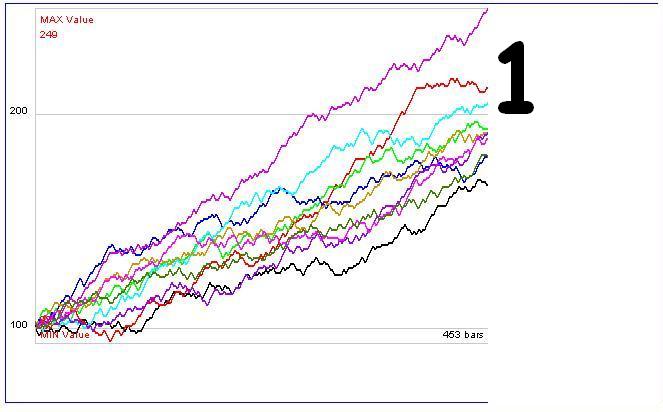
Here are the six charts from the "Readers' Poll" post. The last results I saw (before they magically disappeared from the poll! EDIT: They are back..for now. 5/11/12) had the winner as 3,4 & 6, which is the right answer.
What do they have in common? They each contain 10 random equity curve outcomes by trading a system/method with a Avg Win 3X larger than the Avg Loss with a WR of 30%. This equates to E=0.199.
The other three charts show 10 random equity curve outcomes with the same Expectancy except the combination of R:R (Reward to Risk ratio) and WR is different- Avg Win 1X Avg Loss with WR 60%.
The few people who voted were able to agree with a majority vote that the charts which belonged to a given group looked different to the charts that didn't. The difference is Variance.
A trading system with a lower WR and higher R:R (such as charts 3,4 & 6) will have a higher variance from the mean, an imaginary straight line that transects the wobbly move upwards (assuming positive expectancy). Likewise, a trading system with a higher WR and lower R:R will have a smoother, straighter equity curve that is closer to being like the mean of the data set.
The comparatively very different outcomes possible between the curves, as well as within the curves themselves, within a high variance approach makes sticking it out with a method as difficult as holding on to a trade that whips it's way to a target.
It's not just where the strategy ends up (Expectancy) but how it gets there (a function of WR and RR) that counts.
Expectancy can be calculated using the following formula:
Expectancy= (Average Win * Win Rate)-(Average Loss * Loss Rate)
This needs to be calculated using a "statistically significant data set"- for a swing trader that might mean testing over years or even decades of data. Intra-day traders will probably need a month or two of data. The time over which your data is collected matters because you are inevitably going to test over various market conditions but the number (N) of trades is crucial. The larger the number, the more reliable the expectancy.
So, let's say you forward/back test a trade idea, taking 100 trades. Your WR is 40% (0.4) and your Avg Win is twice your Avg Loss then...
E= (2 * 0.4)-(1*0.6)=0.2... This means, on average, you make 20% (0.2) of whatever your risk (R) is per trade for every trade you make. Positive Expectancy! Yay!
But that's only half the story.


Here are the six charts from the "Readers' Poll" post. The last results I saw (before they magically disappeared from the poll! EDIT: They are back..for now. 5/11/12) had the winner as 3,4 & 6, which is the right answer.
What do they have in common? They each contain 10 random equity curve outcomes by trading a system/method with a Avg Win 3X larger than the Avg Loss with a WR of 30%. This equates to E=0.199.
The other three charts show 10 random equity curve outcomes with the same Expectancy except the combination of R:R (Reward to Risk ratio) and WR is different- Avg Win 1X Avg Loss with WR 60%.
The few people who voted were able to agree with a majority vote that the charts which belonged to a given group looked different to the charts that didn't. The difference is Variance.
A trading system with a lower WR and higher R:R (such as charts 3,4 & 6) will have a higher variance from the mean, an imaginary straight line that transects the wobbly move upwards (assuming positive expectancy). Likewise, a trading system with a higher WR and lower R:R will have a smoother, straighter equity curve that is closer to being like the mean of the data set.
The comparatively very different outcomes possible between the curves, as well as within the curves themselves, within a high variance approach makes sticking it out with a method as difficult as holding on to a trade that whips it's way to a target.
It's not just where the strategy ends up (Expectancy) but how it gets there (a function of WR and RR) that counts.
Saturday, November 3, 2012
Day's Anatomy- 2nd November 2012

34 trades this week (too many). -0.9 pips. I bet my broker is happy :/
Friday, November 2, 2012
Day's Anatomy 1st November 2012

Or, perhaps we should just stick to one of them and ride out the inevitable draw downs in a hopefully up-trending equity curve?
I haven't found the answer. I'm guessing it's the second one though...
Wednesday, October 31, 2012
Day's Anatomy- 31st October 2012

UPDATE!

Day's Anatomy- 30th October 2012- Decide.

Followed along nicely today although I just missed the xxx69 short just. 18:20 ish on the chart (CET). I like the fact that I took all viable signals...something which should obviously always be done.
Ran the first of the two wins. Indecisive on the 2nd/last win. I had three choices:
1) Take the single (6 pips) and take no further action.
2) Take the single then get back in for the expected bigger move.
3) Hold through the pullback AND hold for the bigger move.
...I chose a hybrid of 1) & 3). I wanted the bigger move but then allowed the fact that it came back to break even (and into the red) to shake my resolve, exiting close to the 1 min pivot that it created the first time around.
TWoT (well, four...but you get the idea!)
Reminds me of the time I stepped (yes, stepped!) off a moving bus. Not the smartest thing I've ever done, I'll admit :/
I was trying to follow my mischievous friend who enjoyed doing things like smashing bus stops, doing graffiti or using the emergency exit feature of a bus to jump off whilst it's still moving... leaving behind a blaring alarm and a pissed driver!
This time, I was onboard with him. His act caught me by surprise and so I had to decide whether to stay onboard and face the wrath of the driver or jump off of the relatively slow (it was doing about 15-20mph...)moving bus...
...I couldn't commit to a decision. So I stepped off...lol! I realised I had done the wrong thing by making my non-decision when I woke up on the floor after stepping in front of a street light pole!!! I still remember asking myself what the swishing sound was as I picked myself up off of the floor. I'm sure you can imagine what it was :)
Personally, I think it's better to make ANY decision, even the wrong one, rather than be indecisive. You're almost always going to get a worst result if you don't.
Monday, October 29, 2012
Day's Anatomy- 29th October 2012

The chart explains it all. Those consecutive errors just after midday cost me between 11 and 17 net pips. The long from xx892 could have been held for 4 more pips too. The last trade had to be taken off due to the close. Currently waiting to be filled @ xx901 but already had two chances to get in there.
Not a good day at all.
(Incidentally, Hurricane Sandy seems to have had an effect on Eur/Usd).
UPDATE!

Saturday, October 27, 2012
Readers' Poll!


Friday, October 26, 2012
Day's Anatomy- 26th October 2012

I always knew why volume drops off going into the weekend, but now I get to feel it firsthand. Nobody wants to mess things up going into the weekend! It appears even seasoned traders suffer from the Framing Effect.
UPDATE!

Two fingers to the Framing Effect! Statistically, doesn't mean a thing whether you make then lose just before the weekend/end-of-day etc etc or vice versa. It's all in your head!
Thursday, October 25, 2012
Day's Anatomy-25th October 2012

They still aren't my strong point but I'm closing the gap in performance between trend days and range bound days.
As far as today is concerned, the first trade ended with a loss of 5 pips (in opportunity) and, from that point on, I followed the script. Like yesterday, loads of opportunity within the scope of the methodology.
I'm thoroughly enjoying building the consistency muscle!! The money is almost an afterthought...
Wednesday, October 24, 2012
Day's Anatomy- 24th October 2012

Today saw lots of opportunity within the boundaries of this method, but I was absent for a good chunk of it. Took what I saw, managed it according to the guidelines. Good trading.
Day's Anatomy- 23rd October 2012

A couple of decent paper profits, then the break even result before the subsequent drop pissed me off quite badly. Trade 3 and 4 ruined the day when I treated 3 how I'd have liked to have treated trade 1. Again, TWoT...I should be using that kind of stop on both of these setups but I tried to run it (3) based on the outcome of 1.
Less said about trade 4 the better :)
What should have been a tgt/almost tgt day became a loser.
Monday, October 22, 2012
Day's Anatomy- 22nd October 2012

Otherwise, followed along and did what PA suggested was the right thing to do at the time.
UPDATE!:One more trade taken...

Saturday, October 20, 2012
Day's Anatomy- 19th October 2012

The more discretionary the approach, the harder it's going to be as you gained your results through choices that were more easily affected by your emotions. The solution is simple but not easy- relax and trade as you did before.
Monday did the most damage and was also the day where I deviated from the plan in an obvious way. Tuesday to Friday where good days in terms of following the story and taking action in terms of entries but didn't Mind The Gap, evident from a too frequent occurrence of b/e trades and Wednesday and Friday's suffocated wins which would have ended both days at target rather than 50% tgt and -50% tgt (i.e flat between the two days). Huge difference to the bottom line and the edge in general.
Got some work to do...
Subscribe to:
Posts (Atom)