Showing posts with label data. Show all posts

Wednesday, October 4, 2017

3rd Combine PASSED!


This one is significantly different as it was completed with my partner. To get the lowdown on why I've decided to go the route of working in a trading partnership, check out this video.

To get all the details of this successful Combine, watch this video.

So we are now in a position where we have two FTPs open simultaneously, both of them positive, with one nearing the finish line. The short-term plan is to take one of the funded accounts to a place where we are trading 3-5 contracts at a time and keep the other one at just the 1 contract for income.

Exciting times ahead!

Saturday, April 22, 2017

Back On The Horse - Journey Back To Funded.


Still here and diligently working my way back to TopstepTrader's funded department.

They have FINALLY done away with the 10-Day rule that was such a challenge for me, due to the historical expectancy of my approach to the markets and the fact that being positive with the method (in a way sufficient to weather any bad luck in the form of a DD...) after 10 days in an account isn't a given.

As mentioned in my last post, I'm very active on You Tube now because "blogging is so 90's" (lol @ L&W) and I'm enjoying giving back to the medium that has given me so much inspiration and so many ideas.

If you haven't done so already, smash that "SUBSCRIBE" button and watch me hit those goals over the next few months!

Saturday, December 31, 2016

Personal Account + 100% Resistance = Sideways P&L.

Time to reassess and come up with a plan of attack.

The above is the rolling P&L since mid June '16. A few things that leap off the chart...

1) ~340 trades over the first 4+ months. ~70 trades in the following ~2 months. Last two months have a trade frequency of ~40% of the prior months.

2) Last two months- starting from the black arrow- have resulted in an 20+% range. The black arrow also indicates the start of live trading in my personal account.

3) The high of the above range is an 100% return based on $3K/contract over a few instruments with a per trade risk of ~1.6-2.2% (depending on the instrument).

4) Headline stats before last two months of trading: WR=34%, RR=2.319, E= 0.1489.

5) Headline stats for the last two months of trading: WR=36%, RR=1.824, E= 0.0196.

6) 8 target days (+10%) before last two months of trading.

7) 0 target days for the last two months of trading.

8) 46 trades >= 3R before last two months.

9) 7 trades >= 3R for the last two months...


Going to sleep on this post and return with an analysis of what has changed along with a plan of attack to get back on track!


Tuesday, November 1, 2016

Business As Usual


I only traded 12 of the 21 trading days available this month and still managed to make that achievable ballpark figure that I have in my head. This was accomplished while experiencing three (yes, three!) earthquakes here in Italy. We weren't close enough for it to be any risk to us as we are about 87 Km away but, with the quake measuring a hefty 7.1 on the Richter Scale, it was close enough to move the house from side-to-side, rattle windows and leave objects displaced in the house. Not fun with a family of four. On the plus side, I like that even experiences like this didn't dent my trading composure.

I love not having to rely on WR for results (I "lose" pretty much twice as often as I "win") and I know that if I manage my psychology and follow the plan, the money will eventually follow.

Still waiting on the Funded Account credentials from TST. Should be anytime soon as I've just paid for the data fees and that means the account has been set up on the brokerage side. I'm also adjusting my expectation of take-home profits as commissions are noticeably higher than the Combine (As much as $4.78 compared to $3.68 respectively). Add in the $170 professional data fees and that takes a good chunk out of the monthly figures I've been posting.

The good news is, these costs are fixed. So while commissions will increase as contract load does, the data costs remain the same. Fast forward to 20 contracts per turn and $170 doesn't make up much of cost in terms of percentages at all (1% compared to 1 contract's massive 24%).

Saturday, September 24, 2016

The Problem With FTP

I gave it a good go, but yesterday saw the unsuccessful end to FTP.


I was so busy trying to pass the Combine that I failed to give the proper attention towards what I would do if I actually passed it.

While I don't want to focus on the negative, when entering FTP, it became clear what TST's marketing strategy is and that it's, at best, a bit cunning ...if not immoral.

The Combine entices you into pitting yourself against the market, with a daily stop and an overall, maximum draw-down. You have to trade at least 10 days which means it's very difficult to pass with luck. If you can pass a Combine, it's very likely that you have the attributes necessary to trade profitably long-term.

Then there's FTP.

You have 10 days with your draw-down before the rug is pulled from underneath your feet and you have to be positive- and stay positive -until you reach the lowered profit target. It's almost as if they don't want to fund you...maybe because the funded traders make up, by far, the smallest part of their profits...especially when the first $5000 withdrawn is given to the trader with no profit split!

The combination of having reduced contracts to trade (I went from being able to trade 3 instruments at once to 2), fewer instruments (you can only trade the ones you were profitable in) and no draw-down after 10 days, proved too much for me and forced me to make a critical choice:

1) Trade normally and accept that a normal, run-of-the-mill draw-down could occur during those crucial 10 days. This would mean failing FTP with a long-term, winning approach or

2) Try to modify my approach to guard against draw-down- take smaller wins, more trades etc.

I chose 2. If I were to do it again, I'd just accept that I may fail due to natural variance and leave it at that. But I'm not sure that I will because, IMO, one shouldn't be subject to luck after clearly proving their skill. Of course, if they were to set the same rules for the Combine, they'd find that their clientele would drop off as the offer would be far less inviting.

Time to come up with a plan B. Any comments and suggestions (or investors!) are welcome. Watch this space!

Friday, August 19, 2016

Combine PASSED!


After 2 years and many attempts, I've finally managed to pass TopstepTrader's $30K Combine!


The entire Combine lasted 57 trading days and 260 trades were taken. The vast majority of these trades were made across 4 instruments: 6A (Aus/Usd futures), 6B (Gbp/Usd), 6C (Cad/Usd) and YM (Dow Jones). 5 trades were taken in the ES (S&Ps) and 1 lone trade in CL (Crude futures).

A tightened up the strategy by making things more statistical and objective using the lessons learned  that I covered in this post. This change occurred 9 days into the Combine and is what I consider the beginning of orderly, rules-based trading within the entire data set.

The results after statistics were applied to the method.

The hardest part of achieving this result was giving up control. I used various techniques to help manage myself along the way, which I'll talk about in a future post.The range of emotions experienced were sometimes very hard to deal with, especially given the numerous stressors that have been present in my life over the last 12-18 months or so (births, deaths, financial difficulties, health and relationship...the list goes on and on).

I also met internal resistance when I reached the $1K mark and, then, when the finish line was in sight.

Next up: A post detailing the cost incurred to get to this point in my TST trading journey. Stay tuned :).

Wednesday, August 17, 2016

Running P&L In R

Keeping what I said regarding showing vs being firmly in mind, I've decided to share my running P&L with the trading blogosphere!


I've converted the chart from $$$ to risk units - this allows me to share the journey without the potential pressure of sharing the actual dollar gains/losses. Having said that, the usual caveat applies - if it messes with my ability to trade properly, it'll be gone quicker than cake at a Weight Watchers meeting!!

Reasons for doing this:

1)  During the years of following trading blogs, I only know of two that have consistently posted their P&L without conveniently skipping out periods of time (where anything could have happened!). This one  does so in points, while this one does so with $$$ and accompanying charts. I want to add an element of credibility to my posts so that people can verify how well the principles, spoken about in this blog, translate into real-world results.

2)  It's taken me a long time to begin to understand the nature of probability, variance etc. and how we need to fully understand our expectancy, the journey it can take us on, and adjust our expectations to be able to accept the journey without destroying the long-term edge. This curve will serve as a reminder for me when things look grim and as a reference for any future posts.

NOTE!: Friday 23rd September's result is not accurate as much bigger risks were taken to achieve the ~ -3R result in order to try to get above $0 in order to satisfy an FTP rule. I've normalized the result in order to not skew the curve but the result in actual risk taken would have been closer to zero.

Monday, January 11, 2016

Crude Combine Update + LIVE trading video!

Decided to flip on Camtasia for the last two sessions last week.

This video shows my post trade commentary as the trades run at 4X normal playback speed. I also go through some stats in addition to areas of improvement.

Tuesday, August 18, 2015

Combine Completed!


.....No, I haven't passed yet. But I do have more information/feedback that will guide me towards doing so.

Here are the facts (in no particular order):-

1) The percentage of the target obtained in each of the eight Combines I've taken since last June has increased over time. They are noticeably larger after moving to the $30K Combine.

Here they are in chronological order. The ones in bold are $30K Combines-

3%, 9%, 3%, 37%, 0%, 0%, 49%, 80% (< The one I've just finished...stats in the above screen captures).

2) My plan when moving in to this last Combine was to take advantage of the information gleaned from previous Combines- especially the 5th and the 6th- here is a snapshot of my TST journal which summarises this information...


I basically found that I was able to very consistently net +$200 within 1-3 hours of liquid market action. I needed to allow for a $400 intraday draw for that to happen. The one day out of seven when I wasn't able to achieve this typically resulted in less than a $400 loss.

3) After having a "discussion" with the missus, we decided that I'd no longer talk about the story- the reason why this nearly happened/didn't happen and if I had just done this that or the other...just bare bones results in business-like fashion. Even then, it was to be limited to a weekly conversation if not a fortnightly one.

The period of adhering to this way of operating coincided with the initial run up towards the target.

4) The high coincides with the blog post documenting my results (along with the story of how I got there) along with more frequent conversations with Mrs MM.


What does this all mean to me?


*"1)" Suggests I'm making progress.

*Trading the $30K is the where I need to be.

*Daily structure and an unwillingness to indulge in stories or even results in the short-term is essential.


*I need to use the daily stop and not get drawn in to the idea of taking just one trade per day.


Will establish what I'm going to do in terms of a daily structure then get back on the horse.


Saturday, July 4, 2015

Combine Update - Pushing, Pulling & The Present.

The last post documented the second Continuous Combine as well as most of the 10-Day one (the 10-Day marks the switch from the $100K to the $30K). I've since done another 10-Day and Continuous...I'm currently doing another Continuous- my 6th Combine for the year (7th in total)...


I'm currently two-thirds of the way to the target having traded 5 days. There are a few notable changes I've made to push me in this new direction:-
 
1) One Time frame (less is more)- I've removed the anchor chart. My theory is, take away as much as you can without ruining the integrity of something and you have the most efficient system. Everything I need to know to make profitable decisions can be found in the one chart/TF (15 sec).
 
2) Process Over Outcome- This might seem like an obvious one as we are playing a game of probabilities but it's crucial to ignore what happens (in the short-term- after X number of short-term=long-term then we can look at results) and focus on what needs to be done in the moment according to a given method. We cannot control the outcome, so there is no point in getting upset (or happy) about it. We can, and must, control our actions...i.e. adhere to the process.
 
Therefore, it's very beneficial to get upset (or happy) about not implementing (or implementing) the process.
 
3) Let The Market And Time Do The Heavy Lifting(less is more!)- There have been 14 trading days since the beginning of this Combine. I've sat through 10 and only taken trades in 5 of them. Rushing in to a trade that isn't exactly what you're looking for suggests some kind of fear....fear of a future that lacks opportunity, fear of missing out etc.
 
I once wrote a post about pushing and pulling...this type of back-and-forth, emotional variance leaves us bouncing from trying to reconcile regret (pulling/clinging) to fear of the future (pushing/resistance). All while we ignore what's right there in front of us. The present. The gift of what you need to do, right now, without fear.
 
Here's an excerpt from my TST private journal which shows where my focus now lies...
 
 
Ok! Enough observing of results...time to move on to the next present moment! The next time we look at a result, the Combine will be over (in one way or another) and I'll upload the spreadsheet with all the stats as I did with the last two posts.

Saturday, May 16, 2015

UPDATE - End Of Continuous Combine 2 + 10-day $30K.


Improved on the larger-sized winning day metric...still lower highs and lower lows....
Looking back over my journal, I saw many instances of hesitation after booking profitable trades and even more after losing ones...especially if they were the first trade of the day. I also noticed that I had taken only 40 trades in 23 (trading) days compared to my first attempt, where I took 53 trades in 19 days....

All of this lead me to the conclusion that this particular Combine's parameters were a poor fit for my method's expectancy as well as my risk tolerance.

Taken from April 23rd's journal entry:

"The last three days (21st, 22nd and 23rd) have seen me stop out on the first trade only to be offered at least one opportunity to make it to target from there. Today was an especially profitable day for the method and I just sat by and watched after the initial loss. I was in the zone on paper and would have made an absolute killing if I had taken all trades... but I need to remember that it's not like this, not even close to, everyday...
IMPROVE: Take a smaller combine and express myself...."

I mistakenly avoided risk in an attempt to manage it. With a $3000 maximum draw down and $336.8 risk per trade (6 ticks of risk with 10 contracts plus commissions..) I could only afford to lose 8 in-a-row from the outset before being too close to the draw down limit to trade again. 9 and I would have been out of the game. This pushed me to have an overly tight daily stop equivalent to two losses which meant that, when I started out with a loser as I often did, too much emphasis was placed on the fact that I literally couldn't afford to lose if I wanted to be able to continue trading for the day. This made it almost impossible to trade the edge effectively...

One day's data is missing...total is ~+$100 more than the above...


Higher highs and higher lows!


So, against my own Ego, I determined that the smaller, $30K Combine would be much easier to trade. The reasons are as follows:

1) Lower profit target (on a per contract basis) - The target is $1500. As the max. no. of contracts is 3, this means $500/contract. The larger, $100K Combine required a $6000 profit target with a max. no. of contracts of 10....$600/contract.

2) Much larger draw down allowed (on a per contract basis) - Max. DD is now $1500 ($500/contract) compared to the $100K's $3000 (only $300/contract). This is the main reason for the switch.

The pay-off is a slightly smaller imposed daily stop ($500) of $167/contract as opposed to the $100K's $200/contract ($2000)...but this doesn't concern me in the slightest as I shouldn't be trading anyway if I find myself at those levels of loss in any one day.

The extra DD allows me to use the full daily stop AND still be in the game after a theoretical 3 daily stop-outs in-a-row...

$33.68/cont./trade=$101.04/trade using max. position size. Therefore daily stop= 4 losses (4*$101.04=$404.16 - less than $500). 3*$404.16=$1212.48...

The equivalent daily stop on the larger Combine would have meant hitting the max.DD after only two daily stop-outs in-a-row.

All of this meant freedom to "express" myself/method without immediate fear of hitting the above parameters.

As there is only one day left of this 10-Day Combine, hitting the profit target is not something I'm going to push to achieve. I'm prepared to do another, possibly continuous, $30K straight after this one...especially as I made some small but significant changes 3 days after the MFE was screaming at me to do so.

For the record, here is what the new, MFE-based, approach looks like on paper. Note that the first day's results were traded on SIM to build some confidence in the newly-acquired info....the rest (7) are as traded in the Combine...


Saturday, April 4, 2015

End Of Continuous Combine 1- What I've Learned.

Erroneous last day figure...never breached the daily loss limit but haven't contested it as the end result is the same.

Notice the bounce off of the max. draw down limit...~ -$2500.
 

The solution is clear. Run the winning situation and circumnavigate the fear of short-term loss.

I generally do a good job of cutting the losing days short but need to improve on allowing the winning ones to get big enough to compensate. This is likely caused by a fear of giving back a short-term victory...the cost of which is long-term success...

No matter how good the strategy, everyone who has larger winning trades/days than their losing ones will, to some degree or another, experience that feeling of giving back profits which they could have booked if they weren't looking (and holding out) for larger gains. Trusting an edge which regularly fails you in the short-term is hard for most people to get their heads around.

So, I've reset the combine and this is now my 3rd attempt since June 2014. My goal is to divorce myself from the idea of an individual trade's result (since this is what causes the emotional variance) and train myself to look at aggregate results. The wider the view the better...I'll start with aiming to get through the hour I trade without focusing on each trade and thinking of the session itself as one, big "trade".

Action based on the present, results based on a collection of present moments.

Thursday, March 19, 2015

Combine- Day 14 + Fever.


Spent 10 minutes saving, then re-saving, todays' charts to the HD...wondering why the little image wasn't appearing in the folder. It took me that long to realise that I was saving it as "130315" instead of "190315"!

....yes, some residual effects of the fever I am now just getting over. This was almost certainly caught from my daughter, except she is tougher than me and managed to walk around with up to 38.5C/101.3F while I, on the other hand, was reduced to tears, bedridden for 3 days with 39.2C/102.6F and "head pain" so severe, it made a migraine look like a headache.

I'm now happily drugged up with two antibiotics and a third tablet "to protect me from a stomach ulcer". Joy :).

Things are becoming fairly routine trading-wise. Attempted to move one step closer to respecting the ZoA target by putting in order in to scale out of half when the trade appeared to run out of steam. It was rejected for some unknown reason. So I exited for $175 less than I would have earned if the order had been accepted. Probably a fever-induced error...we'll see tomorrow.

Sunday, December 16, 2012

What I've Learned- Month And Dataset Review.


 First thing to note is that there is an edge, as the pip-count, after spread (half of the costs incurred when trading at this size), is very much positive. Unfortunately those pips haven't quite covered commissions hence the negative result. This has pretty much been the case with my trading for the last three years.

In September's "Trading Without A Compass" post I referenced an idea that has plagued my trading for a long time- The "Profit Ceiling". I am lucky/skilled/aware enough to know when it has been reached but, despite that knowledge, this is how the four weeks panned out:


I know exactly why I traded past the ceiling on every occasion. First off, I refuse to accept that it exists (more on that in the 3rd and final reason). Secondly, I want/expect to be able to trade my method continuously. After all, if it worked to the ceiling, it should work past it right?

Wrong.

Integral to the method is my discretion. So, when I feel as if the ceiling has been hit- it has. Even if it is a self-fulfilling prophecy, it can't be ignored.

The other reason is not easy to write here, but I'm going to say it anyway.

I'm addicted to trading.

Somewhere along the journey, it stopped being about profit and became more about the challenge. Going up against the market is ALWAYS a bad idea. If I had simply stopped trading when I felt like I had bumped into this "Profit Ceiling", I'd have found myself up some $550 on the month, even with the >4R loss that occurred due to a gap against me.

This idea of going up against the market is ludicrous. Most people learn how to create an edge for themselves within a couple weeks/months of careful study of a chart. After that, it's an exercise in self control and a desire for long term results over short term thrill.

A bit disappointed in the lack of participation in this blog (not one vote on the last poll!!!) so may cut back drastically/stop as it's a waste of my time otherwise. I already keep detailed data in the form of spreadsheets (as seen here) and video diaries so only really here to ignite discussion on the real challenge that is trading...

....it's NEVER the market's fault. Long-term results are all our own doing. :)


Saturday, November 17, 2012

Day's Anatomy- 16th November 2012...Readers' Poll 2!

Notice the direction of ALL the trades.
I suddenly started thinking about this post that I made years ago. 2) & 4) in particular.

It (No 4 from the above link) was the same when I started this blog. That is likely why I deliberately started avoiding tracking day-to-day progress in the first place.


Do you see the obvious clues?

In the above equity chart:

Light Green
   = Paper Trading.
Dark Green
   = Live Trading.
Blue
    = Daily Blogging.
So I'm giving myself at least a month of trades without a single blog post (I'll continue updating my records though..spreadsheet, videos etc). Then I'll probably be back to report on any changes.

So I've either succumbed to the pressure of real-money trading or, coincidentally, what I'm doing stopped working when I made the switch. Or maybe it's just a draw down in an otherwise profitable approach.

What do you think?? (see poll on the right of the blog)

Back in a month!

Saturday, October 27, 2012

Readers' Poll!

Have a look at the following six charts:


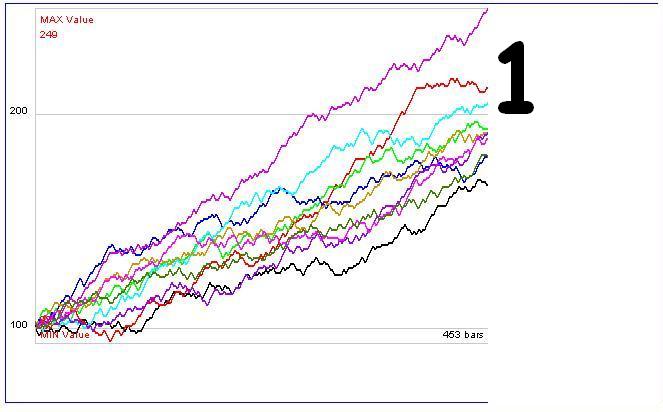
Three of them are derived from one set of data. The other three from another set of data. But how are the six divided?

Answers in the poll situated on the right-hand side of the blog! The result will be used in a blog post in the near future. :)